« All Events
12 PM – AI and ML – Gamas
September 7, 2024 @ 12:00 pm - 1:00 pm
Today We Did
- We continued with Titanic Survival project
- We were able to feed a training CSV file into our learning model and predicts the survival of each of the person inside training CSV and save the result back into another CSV file
Homework
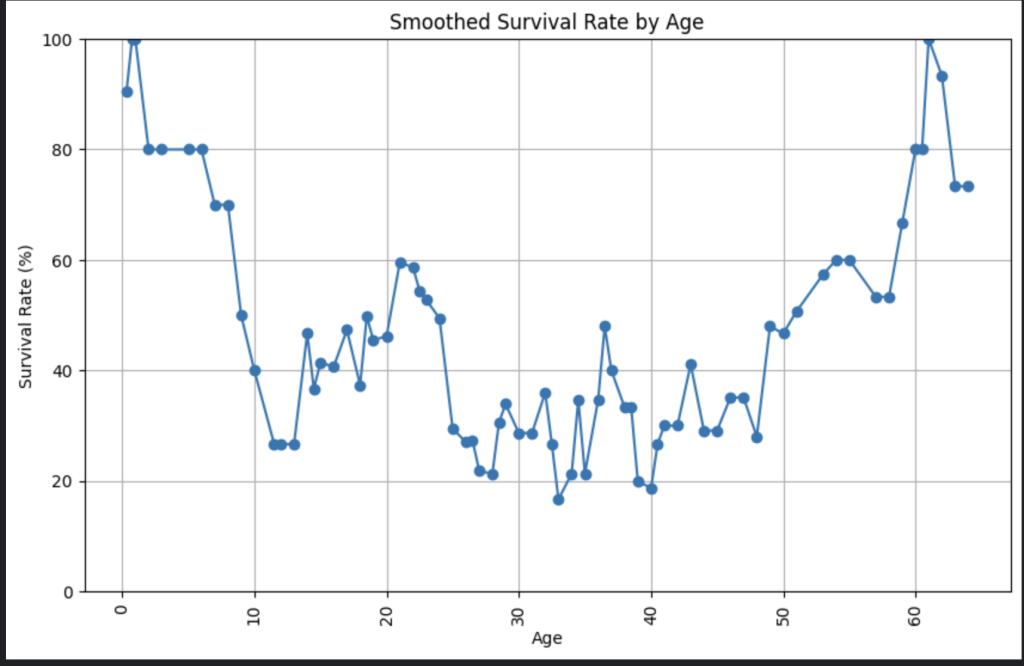
- Research on how to display a chart that will show the percentage of survival base on their age. The type of chart that I expect you to do would be like the following

- You should use import matplotlib.pyplot as plt for creating chart.


